Gatling in 10 Minutes
This is a tutorial that will get you up and running with Gatling load testing tool, as well as a having a Vagarant image running Graphite so you can monitor your testing in real-time.
As prerequisites, you’ll need to have installed Vagrant, Scala and Maven. If you’re on OS-X, I heartily recommend Homebrew for managing packages.
Step 1 - Install Graphite
Get a Graphite Vagrant VM as follows
git clone https://github.com/tilmans/vagrant-statsd-graphite-puppet.git
cd vagrant-statsd-graphite-puppet
By default sets up a port forward on 8080, but we will need to use that for the app to be tested, so lets change it:
sed 's/8080/8081/' Vagrantfile > Vagrantfile.1
mv Vagrantfile.1 Vagrantfile
Start it:
vagrant up
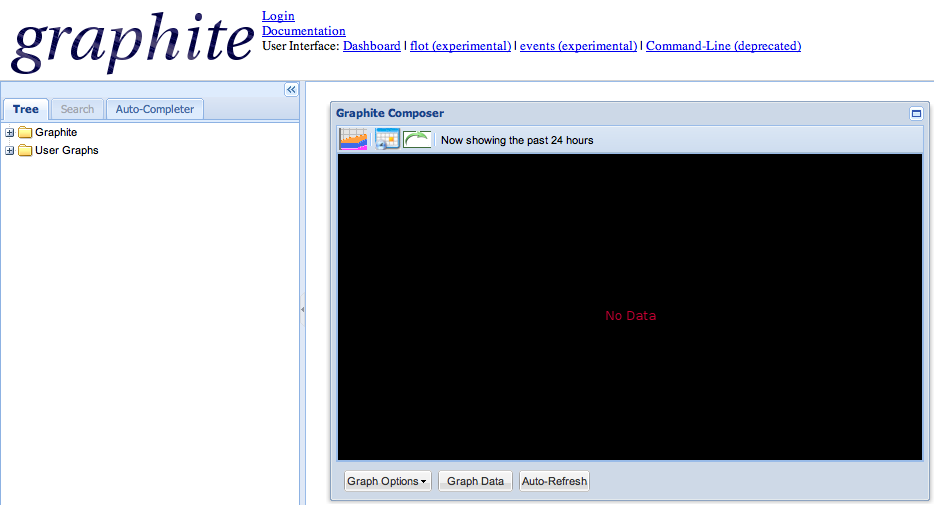
It takes a couple of minutes to download and start, you can check Graphite is running: http://localhost:8081, and you should see something like this:
Step 2 - Run a Test App
Gatling provide a test app, but we want to put a much higher and more sustained load through our application, so we’ll run our own.
I’m using Maven, so an off the shelf archetype will save time:
echo Y | mvn archetype:generate -DgroupId=test -DartifactId=test-webapp -Dversion=1.0.0-SNAPSHOT -DarchetypeArtifactId=maven-archetype-webapp
cd test-webapp
mvn org.mortbay.jetty:maven-jetty-plugin:run
This will take a minute or so to download and start up. You can check it’s working at http://localhost:8080/test-webapp/. You should see “Hello World!”.
Step 3 - Download and Run Gatling
Download Gatling version 1.5.2 from their website and then unpack it:
tar xfz gatling-charts-highcharts-1.5.2-bundle.tar.gz
cd gatling-charts-highcharts-1.5.2
We’ll need to create simulation. Based on Gatling first steps, create a new file user-files/simulations/basic/ExampleSimulation.scala with the following code:
package basic

import com.excilys.ebi.gatling.core.Predef._
import com.excilys.ebi.gatling.http.Predef._
import com.excilys.ebi.gatling.jdbc.Predef._
import akka.util.duration._
import bootstrap._
import assertions._

class ExampleSimulation extends Simulation {
  val scn = scenario("My scenario").repeat(10000) {
    exec(
      http("My Page")
        .get("http://localhost:8080/test-webapp")
        .check(status.is(200))
    )
  }

  setUp(scn.users(200).ramp(100))
}
This starts 200 users and each make 10,000 requests.
To do this higher load, you may need to “unbuckle the seatbelts”, following the instructions on this page. It’s a bit of an advanced topic, so feel free to skip over it for a the time being.
To enable Graphite reporting, you need to uncomment some lines in conf/gatling.conf:
data {
	writers = [console, file, graphite]
	reader = file
}
graphite {
	host = "localhost"
	port = 2003
	bucketWidth = 100
}
Now run the simulation:
./bin/gatling.sh -s basic.ExampleSimulation
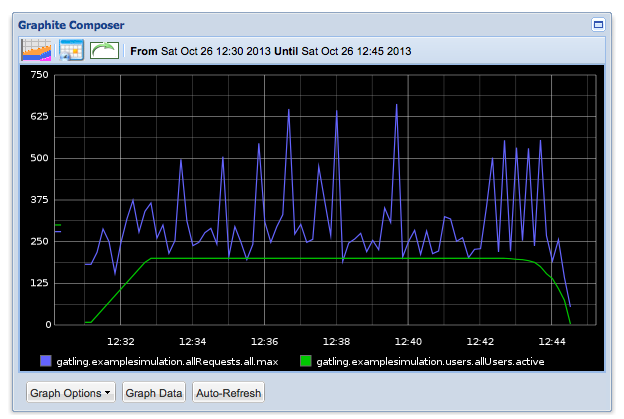
Now if you open Graphite and navigate to Graphite / gatling / examplesimulation / allRequests / max and add Graphite / gatling / examplesimulation / users / active you’ll see something like:
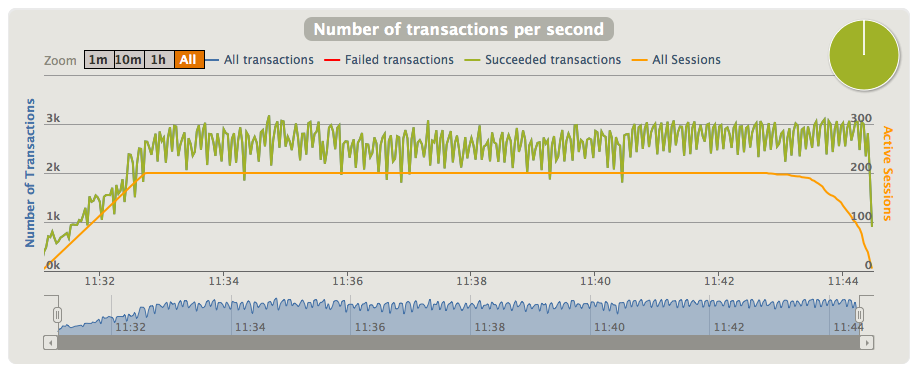
When the simulation is complete, then Gatling will output a graph of results, e.g.: